 |  |
In earlier times in finite elements, problems on meshes were often solved with direct solvers, which greatly benefit from a banded matrix. This depends on node numbering. On a regular grid, you'd number by rows; in an irregular mesh something of that can be achieved by an advancing front, which passes through every node, and numbering is by order encountered.
I have found two current requirements for a front. One is in a shorter way of defining the mesh, for web transmission. And the other is in WebGL. For the latter, I've developed a more easily visualized method, which, as you might guess, leads to pretty pictures. And yes, WebGL. It describes the mesh as a peel. The rind is one triangle thick - each triangle has two nodes on one side, and one on the other. Well, mostly. Details below.
Update: I found that the original mesh had some incorrectly oriented triangles. The method assumes consistent orientation, so it's rather surprising that the algorithm ran to completion. Anyway, it looks much more regular now.
Mesh specification
You can't avoid listing the lat/lon of the nodes. The simple and usual way of listing the connecting lines is by listing each triangle. But there are typically about twice as many triangles as nodes, so each node gets mentioned six times in total, on average.If you can reproduce the motion of a moving front, you only specify each node once, when it is encountered. Since the front passes through each triangle, about half the triangles are created without listing a new node (infilling), although a few bits of info are needed to indicate the kind of infill. This is what I currently do, and it is a big plus for the apps mentioned above. But the front does not advance in an easily visualized way, and so for WebGL I need something else.
The WebGL issue
I've described the use of WebGL elsewhere, for example here. Because it's highly parallel, it tends to be very verbose, since it sends copies of everything rather than use pointers. So every time you mention a node, it is by coords and color - 7 floats. And as above, the default spec by triangles mentions each node about six times.WebGL mitigates this with two structures - TRIANGLE_FAN and TRIANGLE_STRIP. The first is just a ring of triangles around a node. The second is a strip of rectangles with diagonals (all the same way). The saving is that in each, nodes are mentioned once, in each strip, say. That's twice in total, instead of six.
The strip sounds a bit limiting, but there are various ways you can stop and start. You can add degenerate triangles.
So my ambition here is to develop a front that works like peeling an orange with one continuous rind. I don't have the strip in WebGL working yet. But I do have pictures.
The algorithm (briefly)
It works by in effect rolling a triangle from start to finish. Not the same triangle, but moving from one to another in a series of fans. I rotate anticlockwise. There is always a front dividing "old" and "new", and when the fan reaches "old", it switches pivots, and starts another fan.The picture below shows this with shading. The "old" side of the peel is blue, the new is red. There is a blue line joining the centroids of the triangle in number order. Sometimes the rolling gets stuck; it tries a new pivot, but can't move. You'll see those as solid blue triangles in the pic. It escapes by backtracking to the nearest pivot that can move. It's also possible that the front can form a pocket, leaving behind a set of triangles. There's provision for it to check and go back and fill in those areas. There will be a cost in describing that, but it doesn't happen often.
The result
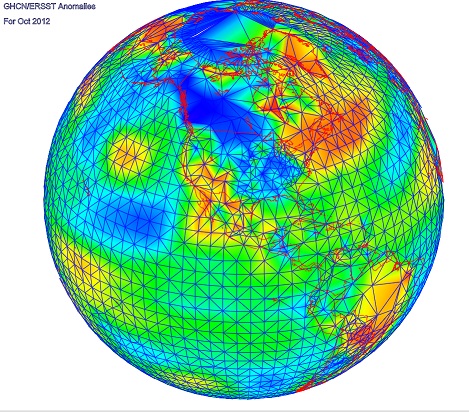
So here is a picture of about 4000 stations (GHCN/ERSST) that reported in some recent month (I've lost track of which). The mesh comes from R's convhull(). There is a red triangle in the Mediterranean where it starts, and end in a white triangle in the W Pacific. I think it is quite interesting how it adapts to very different density in, say, US vs Africa or Antarctic. It's like a big spiral, and as mentioned above, the "old", or inside edge is blue, outer red. The usual WebGL facilities - Earth is a trackball - right button drag up or down to zoom.


Very pretty work, Nick.
ReplyDeleteThanks, Carrick,
DeleteI'm tempted to produce a movie version. No earthly use, but...