GISS cooled, going from 0.89°C in December to 0.78°C in January (GISS report here). That is a smaller drop than TempLS mesh; I originally reported a 0.2°C fall, but later data changed that to a 0.16°C fall. GISS says that January 2018 was the fifth warmest in the record, and was cooler due to La Niña.
Update. I wrote this post based on the GISS report, as the data file was not posted for some time. It is now there, and I see that the December average has been adjusted up from 0.89°C to 0.91°C. That means the drop Dec-Jan is now 0.13°C. This brings it close to the TempLS change of 0.16°C. TempLS also incrased in December due to later data, so in both months GISS and TempLS now track well.
The overall pattern was similar to that in TempLS. Cool in east N America and cold in far East Siberia. Very warm in west of Russia, and in the Arctic. A cool La Nina-ish plume, but warm in the Tasman sea and nearby land. The W US was warm, more so than TempLS showed. Also the W Russia hotspot extended well into central Europe.
As usual here, I will compare the GISS and previous TempLS plots below the jump.
Friday, February 16, 2018
Wednesday, February 7, 2018
January global surface tempLS down 0.2 °C from December.
TempLS mesh anomaly (1961-90 base) fell from 0.762°C in December to 0.565°C in January. This compares with the fall of 0.097°C in the NCEP/NCAR index, and a similar fall (0.16) in the RSS LT satellite index.
According to the reanalysis, the cause was a deep dip late in the month, which seems to be extending into February.
The main cool areas were central asia into Mongolia , and Eastern N America. Also Central Africa. Warm were NW Russia, extending into Europe, and N Canada/Alaska. Also a band right across temperate SH, but still very warm Tasman Sea and around.
Here is the temperature map:
Tuesday, February 6, 2018
Weirdness from Armstrong/Green and conservative media.
This was new to me when it popped up at WUWT. But apparently is has already been around for a week or so, at Fox News and The Australian. Economists Scott Armstrong and Kesten Green, who regard themselves (pompously) as authorities on forecasting, made a splash ten years ago when they made a challenge of a bet with Al Gore that their forecast of global temperature, based on no change, would be better over the next ten years than his. They even set up a website, to track his response, and presumably track the bet. And they got a good run in the conservative media at the time.
Gore never showed any interest - he just said that he doesn't bet. So it was empty noise. However, for some strange reason, there is now a volley of fantasy articles, attributing a bet to Gore (in which he had no say) and declaring him the loser. The terms of the bet are exceedingly arcane. Since they have to make up some warming forecast, they picked an "IPCC" forecast of 0.3°C warming for the decade.
The first thing to say is that the IPCC made no such forecast. They did, in the AR4 SPM that came out at abaout that time, say this:
But that itself turns out oddly. They nominate UAH as a measure, which actually has a slightly higher trend over the period than surface measures. Here is the plot
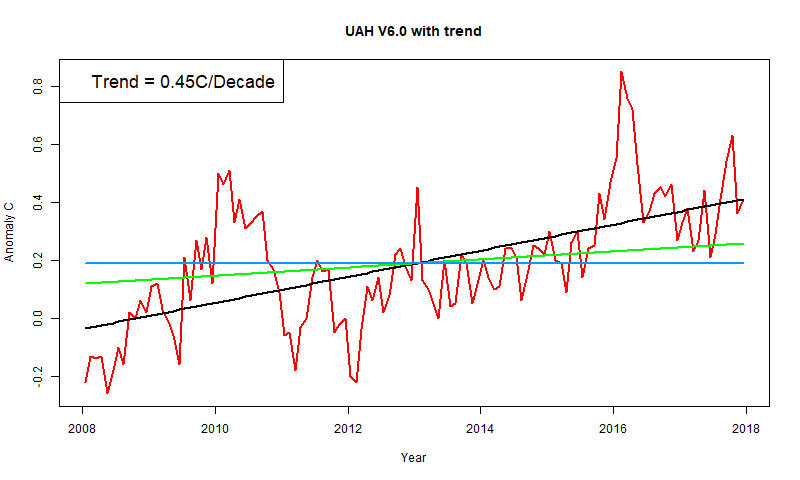
And they are betting with zero trend (blue). The actual was more than double the "IPCC trend". They lose by a mile. But in the WUWT article, at least, they say the OLS trend for the period is 1.53°C/Century. But they prefer a measure they make up called Least Absolute Deviation (LAD).
Well, they would, wouldn't they, because they say that comes out to 1.14°C/Century, and on that basis they declare themselves the winner (since they have pinned Gore with the "IPCC" 3 C/century. Of course it is 2, not 3, so even on that basis they lose. But since they seem to have miscalculated the OLS trend by a factor of 3, I have no faith in their LAD calculation.
On the plot, I've marked a line with slope 1.14°C/century in green, and the Armstrong/Green zero forecast in blue. They all, as fitted lines should, pass through the mean of x and y. See if you think the "LAD" line (1.14) is a better fit. Or whether the no trend forecast is the winner.
Scott Armstrong is a professor of marketing. Kesten Green is a lecturer in Commerce. Neither seems to know much about what the IPCC actually says. And they seem pretty weak in statistics.
Gore never showed any interest - he just said that he doesn't bet. So it was empty noise. However, for some strange reason, there is now a volley of fantasy articles, attributing a bet to Gore (in which he had no say) and declaring him the loser. The terms of the bet are exceedingly arcane. Since they have to make up some warming forecast, they picked an "IPCC" forecast of 0.3°C warming for the decade.
The first thing to say is that the IPCC made no such forecast. They did, in the AR4 SPM that came out at abaout that time, say this:
For the next two decades, a warming of about 0.2°C per decade is projected for a range of SRES emission scenarios.And it was for surface temperature, not the troposphere measure that Armstrong/Green decided on.
But that itself turns out oddly. They nominate UAH as a measure, which actually has a slightly higher trend over the period than surface measures. Here is the plot
And they are betting with zero trend (blue). The actual was more than double the "IPCC trend". They lose by a mile. But in the WUWT article, at least, they say the OLS trend for the period is 1.53°C/Century. But they prefer a measure they make up called Least Absolute Deviation (LAD).
Well, they would, wouldn't they, because they say that comes out to 1.14°C/Century, and on that basis they declare themselves the winner (since they have pinned Gore with the "IPCC" 3 C/century. Of course it is 2, not 3, so even on that basis they lose. But since they seem to have miscalculated the OLS trend by a factor of 3, I have no faith in their LAD calculation.
On the plot, I've marked a line with slope 1.14°C/century in green, and the Armstrong/Green zero forecast in blue. They all, as fitted lines should, pass through the mean of x and y. See if you think the "LAD" line (1.14) is a better fit. Or whether the no trend forecast is the winner.
Scott Armstrong is a professor of marketing. Kesten Green is a lecturer in Commerce. Neither seems to know much about what the IPCC actually says. And they seem pretty weak in statistics.
Saturday, February 3, 2018
January NCEP/NCAR global anomaly down by 0.097°C from December
In the Moyhu NCEP/NCAR index, the monthly reanalysis anomaly average dropped from 0.328°C in December to 0.231°C in January, 2018. There was a big dip late in the month; there are some signs that it is ending. The month was close to November and June, 2017, but a little lower than both. You have to go back to July 2015 (0.164°C) to find a colder month.
AS we have heard quite a lot, it was cold in eastern N America (but warm in W). Also central Asia and Sahara/Sahel. Warm in Arctic and a lot of Europe, and still warm sea around New Zealand. Cool in tropical E Pacific (ENSO).

AS we have heard quite a lot, it was cold in eastern N America (but warm in W). Also central Asia and Sahara/Sahel. Warm in Arctic and a lot of Europe, and still warm sea around New Zealand. Cool in tropical E Pacific (ENSO).
Housekeeping post.
A couple of housekeeping issues. One is an apparent problem with Blogger. I have posted the January results for NCEP/NCAR, but they don't show on the actual blog page, or in the archive. The post does have a place on the web here">, but you can't get to it in the normal way, and it hasn't generated the usual RSS notifications. It may be that Blogger is working on this, because for some time I could see and edit the post on the dashboard where all posts are listed, but now it has disappeared.
I'm posting this partly as an experiment, to see if it suffers the same fate.
Update - it worked. I'll try reposting the earlier post.
The other happening, which I have been spending a bit of time on recently, is the HiREs SST page, and it's consequent movie page. This stopped updating at end 2017. End year glitches in my automated system are not uncommon, but this turned out to be at source. NOAA has reorganised its system, using NetCDF 4 and different directories. They also have a new data set which I'll look at. But anyway, the program is over five years old now, and a bit slow, so I tried to improve. That is never smooth, but I think it is OK now.
Subscribe to:
Posts (Atom)


